
Mastering Chart Patterns for Successful Trading
Are you tired of feeling like you’re lost in a sea of numbers and chart patterns when it comes to trading? What if we told you there’s a way to decode the market and make more informed decisions?
As a funded trader with global aspirations, it’s important to have a solid understanding of chart patterns. Chart patterns are a series of recognizable patterns that appear on price charts of financial assets, such as stocks, currencies, or commodities. These patterns can provide valuable information to traders, helping them to make more informed trading decisions.
Chart patterns are the secret weapon of successful traders. By understanding the language of chart patterns, you can gain an edge over the competition and elevate your trading game.
In this post, we’ll show you how to unlock the power of chart patterns and take your trading to the next level. Are you ready to level up?
Let’s do this!
Common Chart Patterns
There are many chart patterns, but some are more commonly observed than others. The most commonly observed chart patterns include head and shoulders, double top/bottom, and triangles.
-
Head and Shoulders Pattern
A negative reversal pattern that emerges after an uptrend, is the head and shoulders pattern. It has three peaks, the central (the “head”) being the tallest and the two outer (the “shoulders”) being the lowest. The neckline is drawn by connecting the lowest points of the two troughs that form between the peaks.
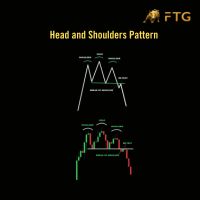
The significance of this pattern is that it signals a potential reversal in the current uptrend. When the price breaks below the neckline, it indicates the bears have taken control, and a new downtrend is likely to begin.
Funded traders can use this pattern to identify potential short positions or exit long positions. Traders can enter a short position when the price breaks below the neckline, with a stop loss placed above the right shoulder. Alternatively, traders can exit a long position when the price breaks below the neckline, avoiding further losses.
-
Double Top/Bottom Pattern
Double-top and double-bottom patterns are reversal patterns that occur at the end of a trend. A double-top pattern occurs when an asset’s price reaches a high point twice and fails to break through, while a double-bottom pattern occurs when the price reaches a low point twice and fails to break through.
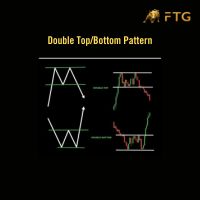
The significance of these patterns is that they indicate a potential reversal in the current trend. Double tops indicate a potential downtrend, while double bottoms indicate a potential uptrend. Funded traders can use these patterns to identify potential entry or exit points.
Traders can enter a short position when the price breaks below the support level of a double-top pattern, with a stop loss placed above the recent high. Alternatively, traders can enter a long position when the price breaks above the resistance level of a double-bottom pattern, with a stop loss placed below the recent low.
-
Triangles Pattern
Triangle patterns are consolidation patterns that occur when the price of an asset moves in a narrowing range. There are several types of triangle patterns, including ascending, descending, and symmetrical triangles.

The significance of these patterns is that they signal a period of consolidation in the market. Traders can use triangle patterns to identify potential breakouts. When the price breaks out of the triangle pattern, it indicates a potential change in the trend.
Funded traders can use these pattern to inform their trading decisions by waiting for a breakout and then entering a position in the direction of the breakout.
Traders can enter a long position when the price breaks above the resistance level of an ascending triangle pattern, with a stop loss placed below the recent low. Alternatively,
traders can enter a short position when the price breaks below the support level of a descending triangle pattern, with a stop loss placed above the recent high.
Newcomers can join Funded Traders Global to enhance their experience and gain profit. Check out our least programs!
That was so informative! Isn’t it? It is!!!
After knowing about common chart patterns. You might be wondering Why identifying chart patterns is important?
Not to worry! In this section of the blog, all your doubts will be solved: Why to identify chart patterns, Key Characteristics of chart patterns, Tips for Improving Patterns, Trading Strategies, How to Identify Chart Patterns, and last but not least Tips for Improving Patterns.
So, let’s quickly get deep into it!!!
Identifying Chart Patterns: A Guide for Traders
Chart patterns are a visual representation of the movement of an asset’s price over time. They can provide traders with valuable insights into the direction of a trend, potential entry and exit points for trades, and the overall market sentiment. However, in order to make use of chart patterns, traders must first learn to identify them in real-time. In this section, we will provide a guide for traders on how to identify chart patterns and develop their pattern recognition skills.
Why Identifying Chart Patterns is Important for Traders
Traders who are able to identify chart patterns in real-time have a significant advantage over those who cannot. By recognizing chart patterns early, traders can anticipate market movements and make informed trading decisions. For example, if a trader spots a head and shoulders pattern forming on a chart, they may choose to take a short position in anticipation of a bearish reversal. Conversely, if a trader spots a bullish flag pattern forming, they may choose to take a long position in anticipation of a bullish continuation.
Key Characteristics to Look for When Identifying Chart Patterns
There are several key characteristics to look for when identifying chart patterns. These include trendlines, support and resistance levels, and chart patterns themselves.
Trendlines: Trendlines are straight lines that connect two or more price points. They can be used to identify the direction of a trend and can help traders anticipate potential breakouts or breakdowns. When identifying chart patterns, traders should pay attention to the slope of the trendline and look for areas where the price may break through the trendline.
Support and Resistance Levels: Support and resistance levels are price levels where the price has previously bounced off or struggled to break through. When traders are looking for chart patterns, they should pay attention to these levels and look for areas where the price may break through or bounce off these levels.
Chart Patterns: Chart patterns themselves are another key characteristic to look for when identifying chart patterns. There are several common chart patterns, including head and shoulders, double tops/bottoms, triangles, and flags/pennants. Each of these patterns has its own unique characteristics that traders should be aware of.
Tips for Improving Pattern Recognition Skills
There are several tips that traders can use to improve their pattern recognition skills. These include:
- Use multiple time frames: Traders can use multiple time frames to identify patterns. For example, they can look for a pattern on a longer-term chart, such as a daily or weekly chart, and then switch to a shorter-term chart, such as a 15-minute or 1-hour chart, to identify the entry and exit points for a trade.
- Practice and analyze historical charts: By studying past patterns, traders can gain a better understanding of the characteristics to look for and the best strategies to use when trading based on chart patterns.
- Use pattern recognition software: There are a variety of software tools available that can scan charts and identify patterns automatically. These tools can be particularly useful for traders who are new to pattern recognition or who want to save time when analyzing charts.
Trading Strategies Using Chart Patterns
Once traders have identified a chart pattern, they can use a variety of trading strategies to take advantage of the pattern. Some common strategies include:
- Trading breakouts: Traders can trade breakouts by entering a position when the price breaks through a key level of support or resistance.
- Trading reversals: Traders can trade reversals by entering a position when a pattern indicates a potential reversal in the direction of a trend.
- Trading with the trend: Traders can trade with the trend by entering a position in the direction of the trend indicated by a pattern.
It is important to note that trading based on chart patterns carries risk, and traders should always use proper risk management techniques to minimize their losses.
Guidance on Identifying Chart Patterns
There are several steps that traders can take to identify chart patterns in real-time. These include:
- Start with the basics: The first step in identifying chart patterns is to familiarize yourself with the most common patterns, such as head and shoulders, double top/bottom, and triangles. Once you’re familiar with these patterns, you can move on to more complex ones.
- Look for trendlines: Trendlines are an essential tool for identifying chart patterns. They can help traders see where support and resistance levels are forming, and they can also help traders identify potential chart patterns. When drawing trendlines, traders should connect the highs or lows of the price action to form a straight line. If the line connects multiple highs or lows, it becomes a trend channel.
- Pay attention to volume: Volume is an important characteristic to look for when identifying chart patterns. When a chart pattern forms on higher-than-normal volume, it can indicate a higher degree of conviction among traders and increase the likelihood of a successful trade.
- Watch for support and resistance levels: Support and resistance levels are price points at which the market has historically had difficulty moving beyond, either due to buying pressure (support) or selling pressure (resistance). When a chart pattern forms at or near these levels, it can indicate that the market is experiencing a significant level of buying or selling pressure.
Tips for Improving Pattern Recognition Skills
Improving pattern recognition skills is essential for technical traders looking to make informed trading decisions. Here are some tips for improving your pattern recognition skills:
- Practice historical data: One of the best ways to improve your pattern recognition skills is to practice identifying chart patterns on historical data. Start by looking for patterns on daily or weekly charts, and then move on to intraday charts.
- Compare your observations to market behavior: After identifying a pattern in historical data, compare your observations to how the market actually behaved. This can help you identify any patterns you may have missed or false positives you may have identified.
- Use software tools: Traders can use software tools that can scan the market in real-time and alert them when a potential chart pattern is forming. These tools can be an invaluable resource for identifying chart patterns.
At Funded Traders Global, we provide our traders with the training and tools they need to identify chart patterns and make informed trading decisions. Our traders have access to various educational resources, including webinars, video tutorials, and trading manuals.
So, why wait? Join us today!
In the next section, we’ll discuss different trading strategies that traders can employ using chart patterns.
Trading Strategies Using Chart Patterns
Chart patterns not only provide valuable insights into market trends but they can also be used as a basis for trading strategies. Here are some common strategies that traders use to make profitable trades based on chart patterns:
-
Breakout Trading
A typical method includes finding a crucial level of support or resistance and waiting for the price to break over that level. When a breakout occurs, traders believe that the price will continue to move in the same direction, potentially resulting in a profitable trade.
For example, if a trader identifies a head and shoulders pattern with a neckline at $50, they may place a buy order if the price breaks through $50, indicating a potential bullish breakout. Conversely, if the price breaks through the neckline to the downside, they may place a sell order to take advantage of a bearish breakout.
-
Reversal Trading
Reversal trading is a strategy that involves identifying chart patterns that indicate a potential trend reversal. Traders look for patterns that suggest a trend is about to change direction and enter trades accordingly.
For instance, if a trader identifies a double bottom pattern, where the price has twice hit a similar low before rising, they may place a buy order with the expectation that the price will continue to rise.
-
Trend Trading
Trend trading involves identifying the direction of a trend and entering trades in that direction. Traders use trend lines, moving averages, and other technical indicators to identify trends and make trades accordingly.
For example, if a trader identifies an uptrend in stock, they may place a buy order to take advantage of potential gains as the stock continues to rise.
-
Swing Trading
Swing trading is a strategy that involves taking advantage of short-term price movements within a larger trend. Traders look for chart patterns that indicate a short-term reversal in a larger trend and enter trades with the expectation of profiting from the swing in price.
For instance, if a trader identifies a descending triangle pattern, where the price has been consistently declining and is expected to break out to the downside, they may place a sell order to take advantage of the short-term price swing.
Now your doubts might be clear! Do something pop-up in your mind? We know how to Use Chart Pattern to Identify Entry and Exit Points.
We are ready for this too. Just have a look…
How to Use Chart Patterns to Identify Entry and Exit Points
Once traders have identified a potential trade setup using chart patterns, they must determine their entry and exit points. Here are some tips on how to use chart patterns to identify entry and exit points:
- Entry Points
Traders can use chart patterns to identify potential entry points by placing buy or sell orders at crucial levels within the pattern. For example, traders can place a buy order at the breakout level of a bullish chart pattern or a sell order at the breakdown level of a bearish chart pattern.
- Stop Loss Orders
Traders must always have a plan in place for managing their risk, and one way to do this is by using stop-loss orders. Traders can place stop-loss orders at key levels within the chart pattern to limit. They’re potential losses if the trade goes against them.
- Take Profit Orders
Traders can also use chart pattern to identify potential take-profit levels. For example, if a stock has broken out of a bullish chart pattern and is trending higher, traders can place a take-profit order at a key resistance level.
It is quite easy! But what about the risk factors of using chart patterns?
Here, we got you covered! In the next section, we have discussed the risks associated with trading using chart pattern and how to lower the risk associated with trading using chart pattern.
Let’s begin…
Risks Associated with Trading Using Chart Patterns
While chart patterns can be useful for identifying potential trading opportunities, they do not guarantee profits. There are several risks associated with trading using chart patterns, including:
- False Signals: Chart pattern may sometimes provide false signals, leading to losing trades.
- Market Volatility: Market volatility can sometimes cause prices to move erratically, making it difficult to accurately identify chart pattern.
- Over-reliance on Chart Pattern: Traders may become over-reliant on chart patterns, leading to a lack of flexibility in their trading strategies.
- Incomplete Information: Chart pattern only provide information on price movements and do not take into account other fundamental factors that may impact the market.
Mitigating Risks Associated with Trading Using Chart Patterns
To mitigate the risks associated with trading using chart patterns, traders should:
- Use other technical indicators and fundamental analysis to confirm chart patterns before making trades.
- Use stop-loss orders to limit potential losses.
- Avoid relying solely on chart patterns and use a combination of technical analysis tools and fundamental analysis to inform their trading decisions.
- Practice proper risk management by limiting the size of each trade and not risking more than they can afford to lose.
- Continuously educate themselves on chart pattern and the market to improve their skills and reduce the risks associated with trading.
Conclusion
In conclusion, chart pattern are a valuable tool for traders to identify potential price movements and make informed trading decisions. Head and shoulders, double top/bottom, and triangles are some of the most commonly observed chart pattern.
Traders can identify these pattern by looking for key characteristics such as trendlines and support/resistance levels. Improve their pattern recognition skills through practice.
Trading strategies using chart pattern can help traders identify entry and exit points for trades. But it’s important to be aware of the risks such as false breakouts, and to mitigate them through proper risk management techniques.
Understanding chart pattern is crucial for traders. Particularly those working with Funded Trader Global, to increase their chances of success in the market.
Demonstrate your trading skills and receive a funded account of up to $500,000.
So, what are you waiting for? Let’s connect and grow your portfolio!